Turn Revit Data into Useful Information
SEPTEMBER 15, 2018 IN DATA, VISUALIZATION, REVIT
BIM technology in the construction industry has been steadily increasing, reaching a point where we can be sure it is here to stay.
Most of the BIM processes and workflows are clear and established for the geometric and visualization tools of the technology but not for data management. We all agree that the parametrization and data provided by BIM software is the key, but it’s not clear which practices are best for obtaining data and processing it to understand patterns or reach conclusions that can lead us into better designs on every project.
The main objective of this article is to dig into better practices to turn raw Revit data into great visualizations that will allow better decisions and workflows on our construction projects.
What is Data Visualization
A primary goal of data visualization is to communicate information clearly and efficiently via statistical graphics, plots, and information graphics. Effective visualization helps users analyze data and evidence. It makes complex data more accessible, understandable, and usable. Users may have particular analytical tasks, such as making comparisons or understanding causality, and the design principle of the graphic follows the task. Tables are generally used where users will look up a specific measurement, while charts of various types are used to show patterns or relationships in the data for one or more variables.
Data visualization is both an art and a science. Increased amounts of data created by Internet activity and an expanding number of sensors in the environment are referred to as “big data.” The same concept can be applied to the construction industry where BIM technology has increased the amount of data or at least made it more accessible. Processing, analyzing, and communicating this data presents analytical challenges. That is why data visualization is key for improving not only the communication of our projects but the practical and clear representation of multiple sources of data.
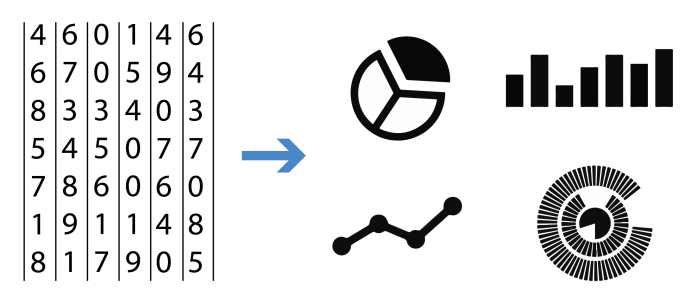
To efficiently visualize data the key factor is to get the right data. This might seem a really simple task, but unless you are dealing with just an small amount of data like a couple of columns and rows in a spreadsheet, you will need robust and clear processes that allow you to take a huge amount of information from multiples sources (Revit, AutoCAD, external databases, Internet, etc.) and multiple formats and be able to get just what you need. After a few steps you can create your visualizations and then start making conclusions.

The Potential of Revit Data
The first thing we need to know is which data is a potential candidate for visualization. It is obvious that we can transform a common Revit schedule or any simple spreadsheet into graphics, but here we are looking for data that needs to be processed and extracted out of Revit to be able to obtain new insights about model/design. The potential of data is limitless but we are going to name a few ways that have been very useful in our company in the last couple of years.
Assisted Design
Every professional from the construction industry that has been involved in a design process is aware that most decisions are not made based on clear data, but a mix of data and the designer’s intuition. Imagine if we could instead create many design options and have a dashboard with the comparison of the exact information like cost, square feet, sun and shadow effects on the building, etc., of each design, that will leave aside all ambiguities and make the designer and the owner’s life so much easier.
This is also something that comes along with the new technologies like Project Dreamcatcher that allow us to iterate between more complex designs. How can we start designing more complex buildings with organic shapes if we cannot measure and compare between the different designs?
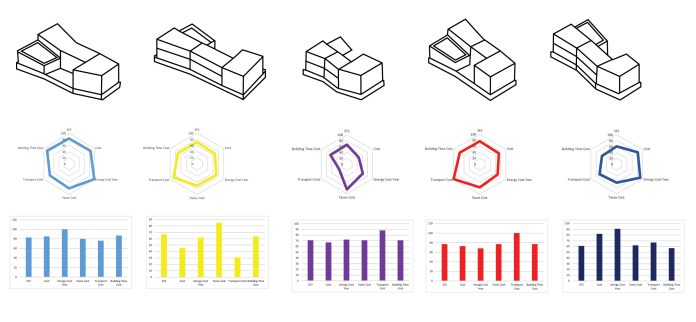
That is why visualization and data mining have become key factors in our current processes of design and future technology even moreso. This will allow us to visualize in real time how the design is changing so we can see the effect of every change we make to our building.
I believe that in the future our role as BIM managers will not only be to deliver fully coordinated drawings and sometimes a couple of detailed schedules, but to provide a precise analysis of the model data and audit of the design in ways we just dream of today.
Collaborative Database
The procedure is something that should be a must in every company because it is powerful. The idea is that you have all project data stored in the same database. This may sound simple but the more projects you have, the more you can benefit. The concept is that you can store the knowledge that you have gained from one project and apply it to others, to improve your learning curve.

A good way to accomplish this is to study how your people are working and modeling. By exporting your database continually you can gain good insight (e.g., the sequence of modeling people are using, the time each task is taking them, the number of warnings on each phase). Then compare all that at the end of the project with the actual time and get conclusions about delays and how to avoid them in the future. This is also a good way of measuring rework.
QC for Validations of Company Standards
We all know how difficult it can be to keep up with BIM internal standards within our company, particularly if you have hundreds of projects going at the same time, with different types of buildings and different locations all over the world. You always have the option to have a quality controller who is the person who checks the quality of the models at all times. However, at times the quality controller either doesn’t do this in a really deep way or you end up hiring an army of quality controllers.
Our approach has been to export model databases once a week and run an automatic control on all models to make sure all of them follow the company standards. Doing this for all your models at the same time saves you a lot of time. You can keep a weekly record of all your company BIM progress.
Comparison of BIM Model Database Versus External Database
Something really useful for the design process is to compare your Revit database with external databases to see how your design compares with the average cost, use or energy, construction code, etc. So you end up having a tool that allows you to know if your design is building code compliant or if you are spending more money than the market average.
At the beginning this is not easy because there is no one database that you can download from the Internet that will include all the information that you need, but once you start using this workflow you end up creating your big source of information.
Machine Learning
Machine learning is a field of computer science that gives computers the ability to learn without being explicitly programmed, so through multiple iterations you can get automatic solutions based on all the previous projects you have been working on. In other words, the more projects you feed your database the more precise your tool will be.
Best Ways to Extract Revit Data
The first step into data visualization is to get the data extracted. We need to consider which tools to use, format, content, and when to extract it.
Dynamo
We all know that Dynamo is a powerful tool for multiple purposes and extracting information from Revit is no exception. Dynamo allows us to export to different platforms (Excel, Access, Microsoft SQL Server, MySQL, or SQLite) using the standard nodes or packages like Slingshot.

The main advantage of Dynamo is that it is easy to use and that apart from the multiplicity of platforms it also allows us to filter the information and export to many different data serialization formats like XML, Json, HTML, etc.

Revit Database Link
This allows you to maintain a relationship between a Revit project and a Microsoft Access, Microsoft Excel, or ODBC database. You can use Revit DB Link to export Revit project data to the database, make changes to the data, and import it back into the project. The database displays Revit project information in a table view that you can edit before importing. This table view also allows you to create Revit Shared Parameters which adds new fields for those parameters in the related tables. Any change made to these new fields within the database updates Revit Shared Parameters upon future imports.
BIM Link
With Ideate BIMLink, Autodesk Revit users can pull information from a file into Microsoft Excel and push volumes of precise, consequential BIM data back into your Revit model with speed, ease, and accuracy. Data management tasks and workflow take a small fraction of the time they once took. The cumulative advantage means more hours freed. You gain unprecedented access to the Revit modeling data you need, for an enhanced workflow.
Custom Macro or Add-in
Another good option is to write a custom add-in or macro adapted to your specific processes.
Which Database to Use
Excel
Most of us work every day with Excel, which is sometimes regarded as a simple tool for inserting information in cells and creating relations between them, but that is just a reductionism. Excel is simple to understand and learn for new users yet it is powerful and allows us to store a lot of information, process data, create algorithms, create visualizations, etc. So that is why it is a great starting point for all those users who are not familiar with programming or have never worked with relational databases.
Microsoft SQL Server
Microsoft SQL Server is a relational database management system. As a database server, it is a software product with the primary function of storing and retrieving data as requested by other software applications — which may run either on the same computer or on another computer across a network (including the Internet). I would say that this database is far more robust and powerful than Excel if your main goal is data processing, so I would suggest this as a good option if you are a more advanced user.
Other Databases
There are many more database options including MySQL, SQLite, or whatever database you’re using. The important thing is that you have a tool that allows you to get the information that you need.
What to Export
The first thought might be to export only the information that you need, but the best practice is to export the entire Revit database every time, so you don’t lose any information. The key here is to get as much information as you can to make more robust processes on every project.

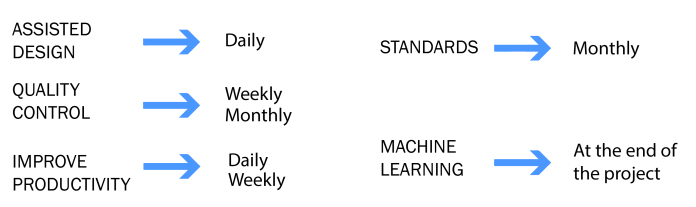
When to Export Revit Data
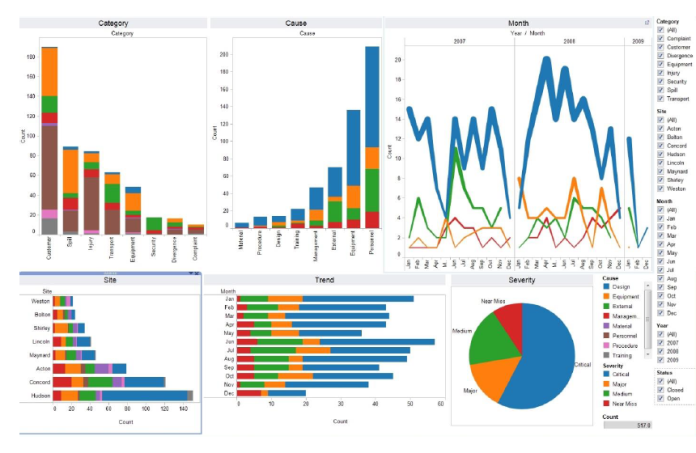
When to export Revit data depends on how you are going to use the information that you export and how you’ve set up the processes in your company. For a quick rule of thumb reference the chart below:
How to Transform Revit Data into Useful Information
Process mining analytics made us realize that we use our IT system to store information, but those systems don’t automatically facilitate efficient processes. Data mining is the computing process of discovering patterns in large data sets involving methods at the intersection of machine learning, statistics, and database systems. This is an essential process where intelligent methods are applied to extract data patterns. It is an interdisciplinary subfield of computer science. The overall goal of the data mining process is to extract information from a data set and transform it into an understandable structure for further use.

So what we get from the KIWD Pyramid (above) is that there is a hierarchy of data. Our main goal is to transform Revit raw data into wisdom so we can predict events, make better decisions, and improve our processes. Behind the hierarchy there are multiple processes that we have to follow in order to go from bottom to top. See the image below for all the steps involved in making this happen:

Steps to Start Digging
Selection — We start by selecting the correct data that we are going to use. For example, let’s say we have a complete Revit database and we want to dig into natural illumination calculations. What we are going to do is take the data that is related with this and exclude things like MEP calculations or structural calculations that have nothing to do with what we are studying.
Clean data — In this step we make sure that the data we are using is correct and remove incorrect data. For example, with trough algorithms we can detect if there are any outliers in our data set that we will need to discard or if there are any missing values in our set that we need to include.
Normalize data — Here we normalize all data because it is common to have information coming with different formats and scales, data that is textual, numeric, binary, etc. So we need to take everything that is equal; or, if that’s not possible, make the correlation of variables.
Data mining — In this step we find patterns, essentially applying different calcification algorithms to data. Some examples are decision threes, K nearest neighbors, support vector machines, K-means, etc. We do it this way because we have large sets of information and the only way to get patterns relatively quickly is the use of these algorithms.
Interpretation — Interpretation is not an automatic process, but something that the person has to do looking at the information. That is why visualization is key here: it allows us to understand quickly and accurately the output of the data mining process